
Core Web Vitals are Google’s key metrics that measure user experience on websites. Surprisingly, only 20% of websites pass all three Core Web Vitals tests. Our team looked at over 208,000 webpages to learn about how real sites stack up against these standards. Google started using Core Web Vitals as a ranking factor in 2021, and these metrics now affect search visibility. Sites that meet the standards see a 3.7% boost in their search results.
The data shows some interesting patterns. About 53.77% of sites scored well on Largest Contentful Paint, while 65.13% managed to keep good Cumulative Layout Shift values. The numbers also show that 53.85% of websites achieved good First Input Delay ratings. These metrics matter to businesses. Vodafone saw an 8% jump in sales after they improved their LCP. Renault’s story is even more compelling – they boosted conversions by 13% with just a 1-second LCP improvement. This piece will help you understand these Core Web Vitals metrics, show you how Google tracks them through the Chrome User Experience Report, and give you practical ways to boost your Core Web Vitals score.
What Are Core Web Vitals and Why They Matter
Core Web Vitals are Google’s key metrics that measure how users experience websites in actual use. These metrics look at three vital aspects of page performance: loading, interactivity, and visual stability. They provide a standard way to evaluate user experience quality, which helps Google compare sites and decide search rankings.
Sites that perform poorly on these metrics see higher bounce rates, less user involvement, and fewer conversions. Those meeting or going beyond Core Web Vitals standards tend to rank better in search results, which boosts their visibility and organic traffic. Let’s get into each of these significant metrics.
Largest Contentful Paint (LCP) for load speed
LCP shows how fast a webpage’s main content loads—specifically from when users start loading until they see the largest image or text block in their viewport. This metric reflects loading speed from the user’s viewpoint rather than technical backend measurements.
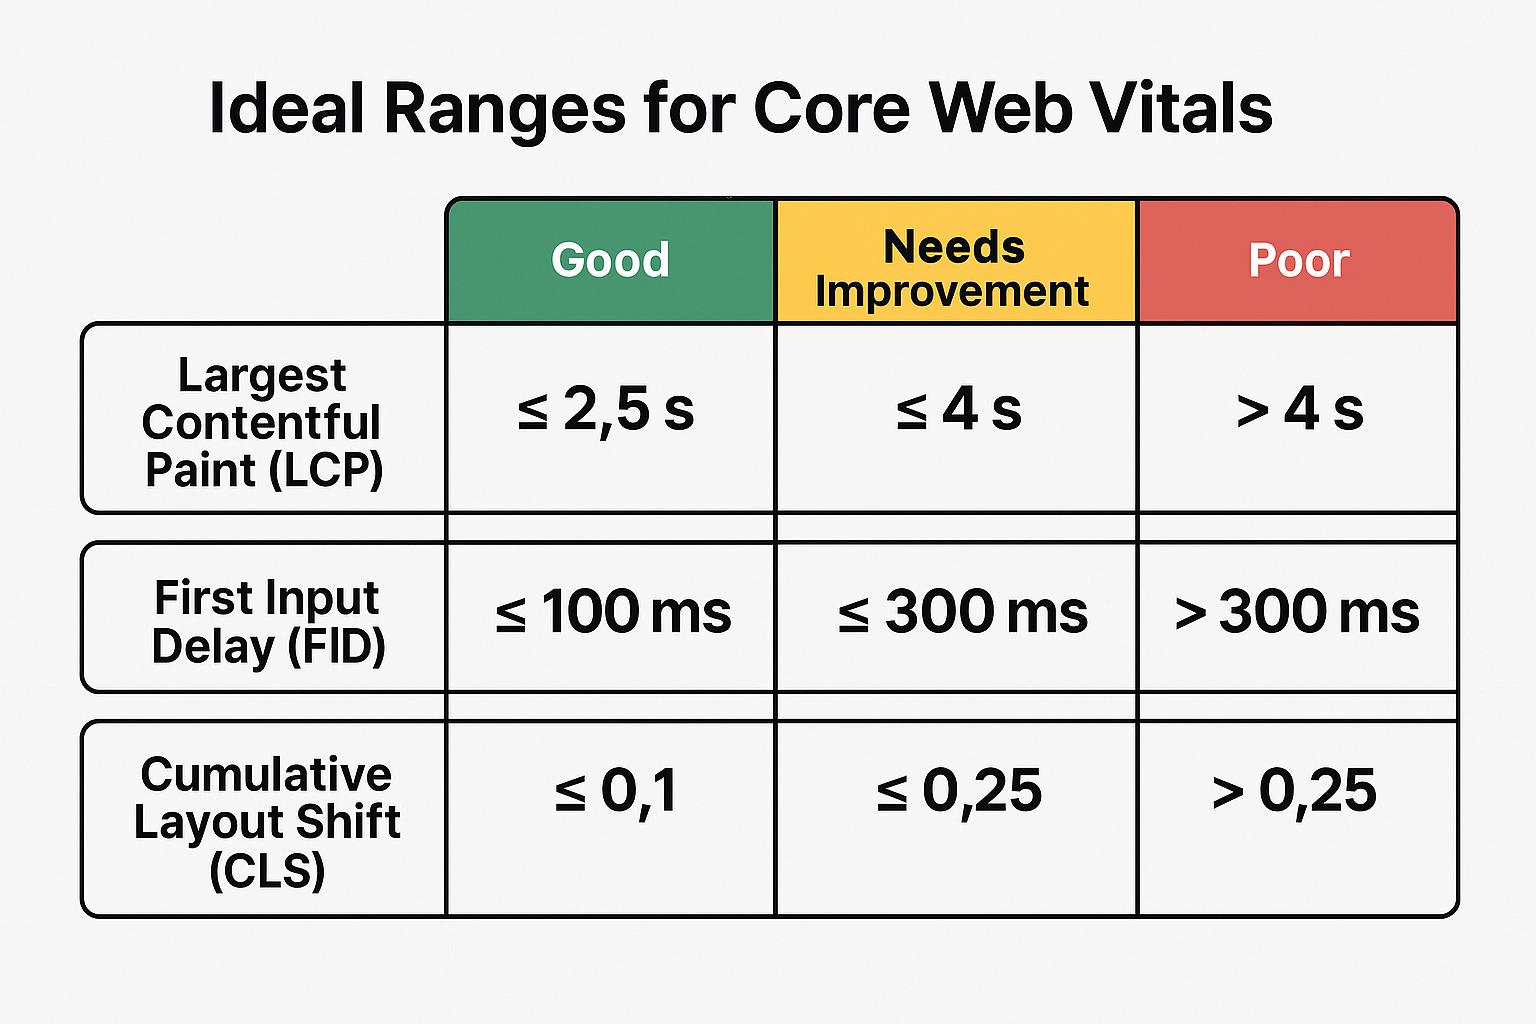
Your LCP should happen within 2.5 seconds after the page begins loading. This target needs to be met for at least 75% of page visits on both mobile and desktop devices. Meeting this standard is vital because content that loads slowly frustrates users who might leave your site before they even start.
LCP timing consists of four parts: Time to First Byte (TTFB), resource load delay, resource load duration, and element render delay. Making each part faster helps achieve better overall loading times.

Interaction to Next Paint (INP) for responsiveness
INP measures your page’s overall responsiveness by tracking how long all clicks, taps, and keyboard interactions take during a user’s visit. It shows how quickly your site responds when users interact with it and how soon they notice visual feedback.
A good user experience requires an INP of less than 200 milliseconds. Pages with INP between 200-500 milliseconds could use improvement, while those taking longer than 500 milliseconds respond too slowly. The interaction lag includes three main components: input delay, processing time, and presentation delay.
INP took over from First Input Delay (FID) as a Core Web Vital in March 2024. The main difference lies in scope – FID only looked at the first interaction, while INP watches all interactions throughout the page’s life, giving a full picture of responsiveness.
Cumulative Layout Shift (CLS) for visual stability
CLS measures visual stability by tracking unexpected layout changes during a page’s lifetime. Layout shifts happen when visible elements move position between frames. These movements typically occur when resources load asynchronously or when new DOM elements appear before existing content.
The best user experience comes with a CLS score under 0.1. Scores between 0.1-0.25 need work, while anything above 0.25 shows poor visual stability. Your CLS score comes from multiplying the impact fraction (shifted visible content) by the distance fraction (element movement distance).
Not every layout shift causes problems—only unexpected ones count in your CLS score. Changes happening within 500 milliseconds of user input don’t count since users expect them. A “load more” button click naturally moves content as new items appear. These three Core Web Vitals combine to give a full picture of user experience. Better metrics mean improved search rankings and create faster, more responsive, and stable experiences that keep users coming back to your content.
How Google Measures Core Web Vitals in the Real World
Google collects Core Web Vitals data from millions of website visits in the wild rather than controlled lab environments. This ground data gives a clearer picture of how users experience websites on different devices, networks, and locations.
Chrome User Experience Report (CrUX) data limitations
The Chrome User Experience Report serves as the foundation of Google’s Core Web Vitals measurement system. It gathers anonymous performance data from opted-in Chrome users. The system has several key limitations:
- Chrome-only data collection: CrUX only collects data from Chrome browser users. Users of Safari, Firefox, or other browsers are not included. Chrome on iOS and Android WebViews don’t show up in the dataset.
- 28-day rolling window: Your site’s Core Web Vitals scores won’t show immediate improvements because CrUX combines data over 28 days.
- Eligibility requirements: Pages need public access, no robots.txt blocking, and enough traffic to protect user privacy. Pages that lack sufficient data get grouped at the origin level.
- Limited segmentation: CrUX breaks down data by mobile, desktop, and tablet. It doesn’t offer the detailed filtering you’d find in dedicated RUM solutions.
CrUX data offers a good overview of performance trends but lacks the detailed insights needed to optimize fully.
Real User Monitoring (RUM) vs Lab Testing
Field data (RUM) and lab data work together in Core Web Vitals assessment: Real User Monitoring tracks performance metrics as visitors browse your website under varied ground conditions. RUM data shows actual user experiences across devices, network speeds, and locations. This makes it perfect to understand your site’s overall performance.
Lab testing measures performance in controlled environments with preset network and device conditions. Tools like Lighthouse run synthetic tests that give consistent, reproducible results. This helps you find and fix specific issues.
The main difference lies in how data looks – field data shows a range of experiences rather than a single number. Google points out that “some people may see your site load very quickly, while others see it load very slowly”. This explains why lab tests often differ from field data.
Field data thresholds for Core Web Vitals report
Google sets “good” and “poor” thresholds for Core Web Vitals based on extensive CrUX data analysis: At least 10% of origins must meet the “good” threshold in CrUX data for it to be achievable. Google confirms that well-optimized sites hit these thresholds despite field data variations.
The “poor” threshold marks performance levels that only a small number of origins (usually the bottom 10-30%) fail to meet. Data showed almost 50% of origins have CLS scores of 0.05 or lower. This helped set 0.25 as the right “poor” threshold.
Google’s Core Web Vitals report in Search Console shows performance at the 75th percentile. Your page needs 75% of views to hit target metrics for a “good” rating. A page passes Core Web Vitals assessment when the 75th percentiles of all three metrics (LCP, INP, and CLS) meet the “good” thresholds. This approach makes sure Core Web Vitals reflect most users’ experience while giving website owners realistic targets.
Optimization Techniques for Each Core Web Vital Metric
Your site’s core web vitals need specific strategies for each metric. Our team analyzed over 250,000 websites and found that good optimization substantially affects user experience and search visibility.
Reducing LCP with image compression and server-side rendering
The first step to reduce Largest Contentful Paint is image optimization. WebP and AVIF formats deliver over 30% smaller file sizes compared to JPEG equivalents. The right compression techniques—lossy for background images and lossless for logos—keep visual quality high while pages load faster.
Improving INP by minimizing JavaScript execution time
Interaction to Next Paint has three components: input delay, processing time, and presentation delay. JavaScript execution time needs to stay low since Lighthouse warns you when execution exceeds 2 seconds and fails if it hits 3.5 seconds.
You can improve responsiveness by splitting JavaScript tasks into smaller, asynchronous pieces. This keeps the main thread clear during user interactions. On top of that, it helps to move heavy calculations to Web Workers, which frees up the main thread for user inputs.
The browser can paint before running time-consuming tasks if you yield to the main thread through setTimeout or scheduler.yield. This creates a smoother, more responsive experience.
Fixing CLS with reserved space for dynamic content
Pages shift layouts when visual elements move unexpectedly during loading. Images without dimensions cause most CLS issues. You can curb this by adding width and height attributes to images, videos, and iframes.
For responsive images, you can make use of the CSS aspect ratio feature:
- Add width or height attributes to images
- Set the aspect ratio using CSS
- Let the browser calculate missing dimensions
Ads often cause layout shifts. You can minimize this by giving ad containers fixed dimensions based on typical ad sizes from your data. Keep those reserved spaces even when ads aren’t showing—just use placeholders instead. Dynamic content like banners and forms need space reserved ahead of time. You can also put them lower in the viewport to reduce their CLS impact.
Tools to Monitor and Improve Core Web Vitals Score
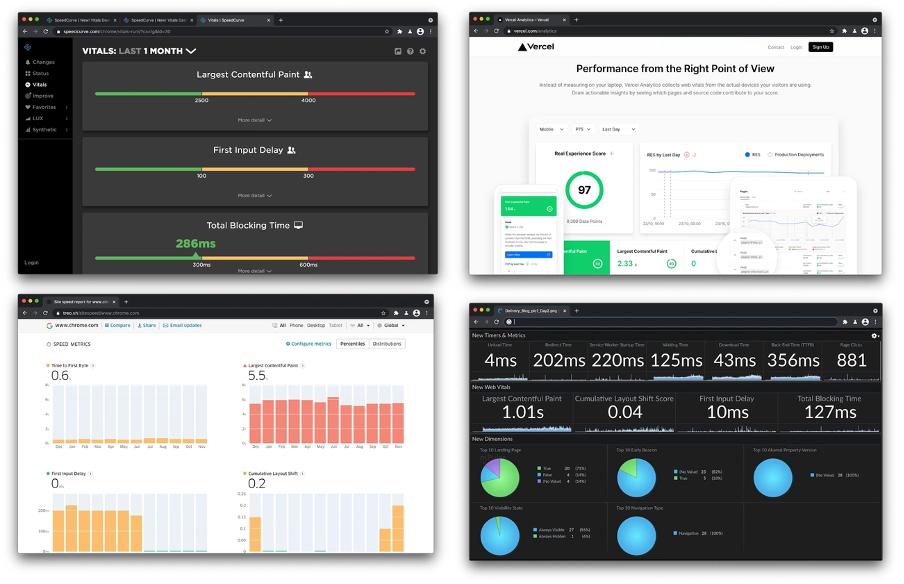
Image Source: Addy Osmani
You need reliable tools that give useful insights to monitor your Core Web Vitals. Let’s look at the tools that help spot performance problems and track improvements.
Using Google Search Console’s Core Web Vitals report
Google Search Console has a free Core Web Vitals report that shows URL performance by status (Poor, Need improvement, Good) and metric type (CLS, INP, LCP). The report’s total data comes from real users through the Chrome User Experience Report, which helps you learn about your site’s actual visitor experience. The report breaks down metrics by mobile and desktop platforms and shows detailed information about problematic URLs.
DebugBear and Caliber for continuous monitoring
DebugBear and Caliber give more detailed insights than one-off testing tools. It combines field data with daily Lighthouse lab tests from 20+ global locations. Caliber schedules site speed tests at specific intervals automatically. You can set performance goals and view changes over time. These platforms come with visualization tools, email reports, and regression alerts that work without complex dashboard setup.
Chrome DevTools and Lighthouse for lab testing
Chrome DevTools’ Performance panel features a live view of your local Core Web Vitals metrics. The metrics update as you interact with pages. The panel can show field data from CrUX too. It highlights the LCP element visually and records interactions with their latency times, which makes finding specific problems easier. Lighthouse, built into Chrome DevTools, runs detailed audits for performance metrics. It creates specific recommendations to improve Core Web Vitals. Lighthouse measures synthetic metrics in a controlled environment, but it helps find optimization opportunities that could affect real-user experiences.
SEO and Business Impact of Core Web Vitals
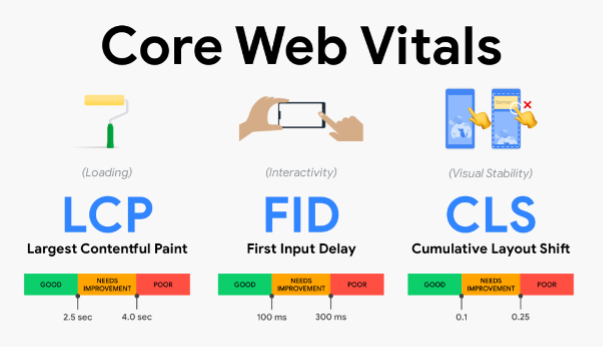
Image Source: Yottaa
Google’s introduction of Core Web Vitals as ranking signals in 2021 has made these metrics significant factors in determining website visibility and business success. Our analysis of 250,000+ websites shows clear benefits for sites meeting these performance standards.
Ranking boost from passing Core Web Vitals assessment
Google has confirmed that Core Web Vitals directly shape search rankings, though content relevancy remains the key factor. Pages with better Core Web Vitals gain an edge when two pages offer equally relevant content. Sistrix data shows sites passing all Core Web Vitals tests get an extra 3.7% visibility on Google search results pages.
Your site needs 75% of users to have a “Good” experience across all three metrics to maximize ranking benefits. Small improvements below the “Good” threshold can boost rankings. Your site won’t see additional ranking benefits once it reaches the “Good” threshold.
Case studies: Vodafone, Yahoo Japan, Renault
Real-life examples show how Core Web Vitals improvements boost business metrics:
- Vodafone saw an 8% increase in sales and an 11% rise in cart-to-visit rate after improving LCP by 31%
- Yahoo! Japan News achieved 15.1% more page views per session and 13.3% longer sessions by reducing CLS by 0.2
- Renault boosted conversions by 13% with just a 1-second LCP improvement
The Core Web Vitals data from 250,000+ websites reveals fascinating insights about SEO and performance. You can compare your site against top performers.
How Core Web Vitals affect bounce rate and conversions
Core Web Vitals strongly correlate with user behavior. Sites that load in 1 second see bounce rates around 7%, while 5-second load times push bounce rates up to 38%. Sites loading in 1 second achieve conversion rates three times higher than those taking 5 seconds.
Google’s study of millions of page impressions shows users stick around 24% more often on pages meeting Core Web Vitals thresholds. Better performance creates a positive cycle: improved metrics boost engagement, lift rankings, and drive more traffic and conversions.
Conclusion
From Metrics to Measurable Results
Core Web Vitals stand out as critical performance indicators that directly affect search visibility and business outcomes, based on our analysis of over 250,000 websites. Google emphasizes these metrics because users naturally prefer websites that load quickly, respond right away, and stay visually stable.
Real numbers tell the story clearly. Websites that pass all Core Web Vitals tests see a 3.7% boost in search results visibility. Companies like Vodafone and Renault saw their conversions soar by 8% and 13% after they optimized their LCP scores. These results show why website owners should prioritize Core Web Vitals optimization to improve performance.
Our exploration covered three essential metrics: Largest Contentful Paint measures loading speed (target under 2.5 seconds), Interaction to Next Paint checks responsiveness (keep below 200ms), and Cumulative Layout Shift tracks visual stability (stay under 0.1). Each metric needs specific optimization approaches – from compressing images and using server-side rendering for LCP to splitting JavaScript tasks for INP and keeping space for dynamic content to reduce CLS.
Many tools can help track and enhance these metrics. Google Search Console gives free Core Web Vitals reports using field data, while DebugBear and Caliber track continuously. Chrome DevTools and Lighthouse give applicable information right in your browser for hands-on testing.
Core Web Vitals and business success clearly go hand in hand. Sites that load in 1 second see bounce rates around 7%, while 5-second loads push that to 38%. Faster sites then achieve conversion rates three times higher than slower ones.
Web performance’s future depends on these accessible metrics. Optimizing Core Web Vitals takes effort, but better user experience, search visibility, and business results make it worth the investment. Begin your optimization today, and your users will thank you tomorrow.
FAQs
Q1. What are Core Web Vitals and why are they important? Core Web Vitals are Google’s key metrics for measuring user experience on websites. They focus on loading speed (LCP), interactivity (INP), and visual stability (CLS). These metrics are important because they directly impact search rankings, user engagement, and business outcomes.
Q2. How does Google measure Core Web Vitals in real-world scenarios? Google uses field data collected through the Chrome User Experience Report (CrUX) to measure Core Web Vitals. This data comes from actual Chrome users browsing websites under various real-world conditions, providing a more accurate picture of user experience than lab testing alone.
Q3. What are some effective ways to improve Core Web Vitals scores? To improve Core Web Vitals, focus on optimizing each metric individually. For LCP, use image compression and server-side rendering. To enhance INP, minimize JavaScript execution time. For CLS, reserve space for dynamic content and ensure images have proper dimensions.
Q4. Which tools can help monitor and improve Core Web Vitals? Several tools are available for monitoring and improving Core Web Vitals. Google Search Console offers a free Core Web Vitals report. DebugBear and Caliber provide continuous monitoring solutions. For hands-on testing and optimization, Chrome DevTools and Lighthouse are excellent options.
Q5. How do Core Web Vitals affect SEO and business performance? Core Web Vitals have a significant impact on SEO and business performance. Websites passing all Core Web Vitals tests can gain up to 3.7% extra visibility in search results. Improved Core Web Vitals scores have been shown to increase sales, reduce bounce rates, and boost conversion rates for many businesses.